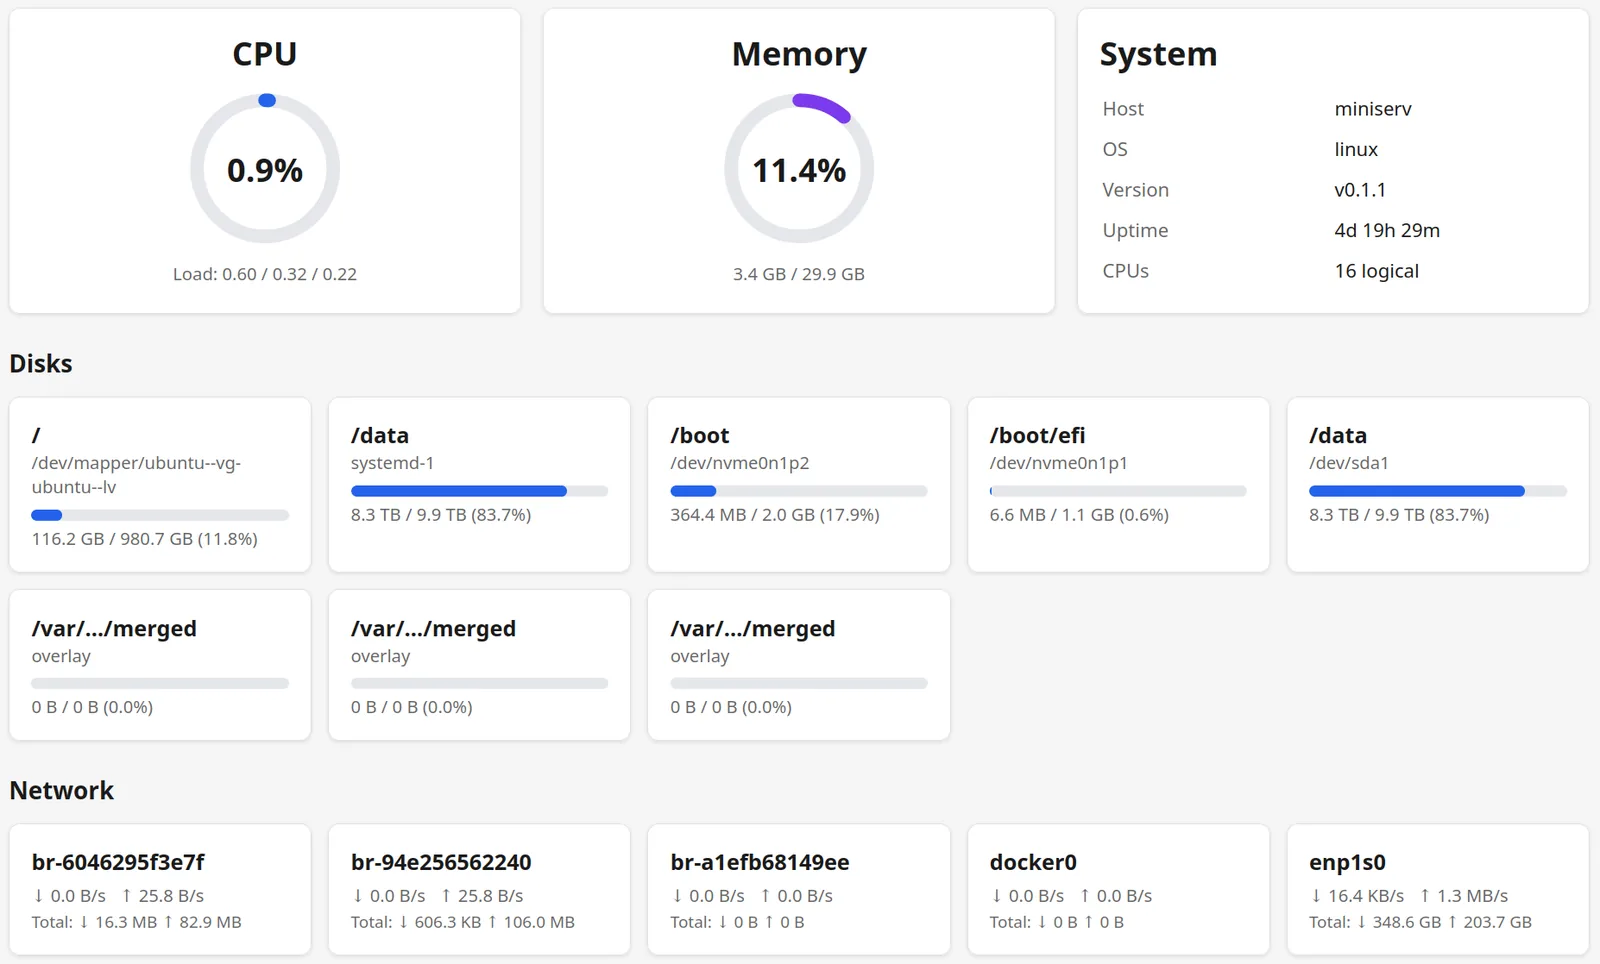
Dashboard gauges — real-time system metrics
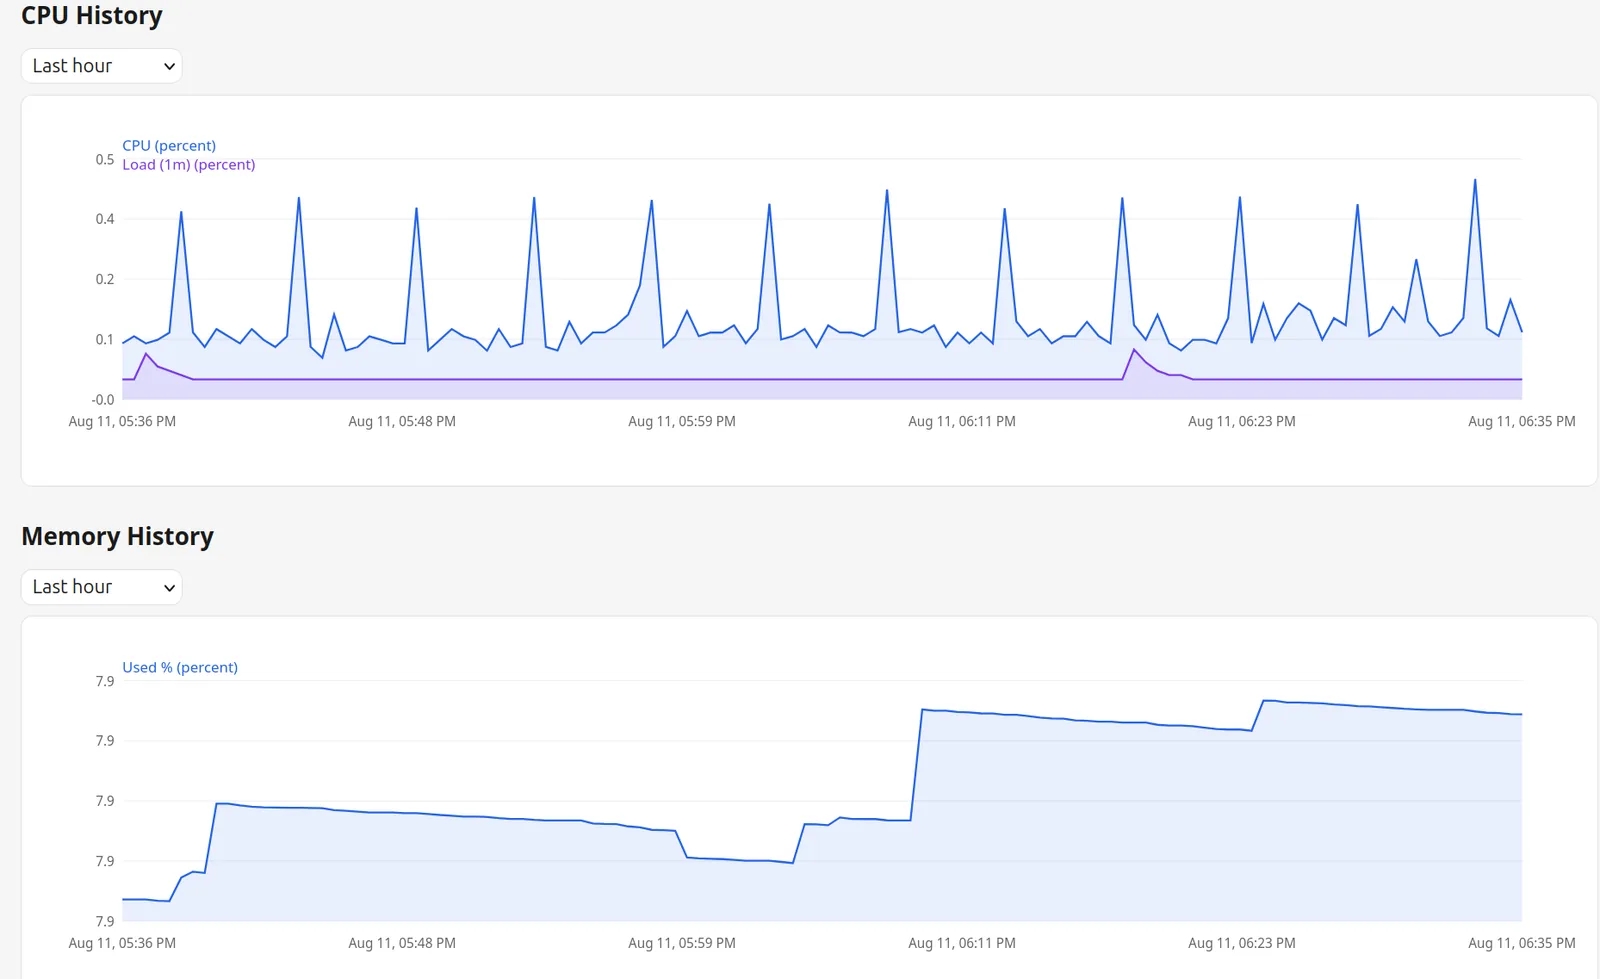
Historical charts — CPU, memory, disk, network
A self-hosted, single-binary system metrics viewer that collects CPU, memory, disk, and network metrics, persists them locally with RRD-style rollups, and serves a browser dashboard — no cloud, no database, no telemetry.
You want to see what your server is doing right now and over time without shipping metrics to a SaaS platform or standing up a full monitoring stack. TheWatcher gives you a single binary to copy and run, a browser dashboard with gauges and line charts, and durable local history with predictable retention — all from one Rust binary.
One binary to copy and run. No cloud, no telemetry, no accounts.
Embedded web UI with real-time gauges and historical line charts. No CDN, no external assets — everything is baked into the binary.
Rust + AxumGranular 30-second samples rolled up into hourly, daily, monthly, and yearly summaries. Configurable retention at every level.
All API endpoints are read-only — no configuration changes, no command execution, no file browsing. Safe to expose on your network.
Metrics stored in append-only BSON files via MooFile. Deterministic IDs make rollups idempotent and restart-safe.
EmbeddedBinds to 127.0.0.1 (loopback only) unless overridden. Runs as unprivileged user. Graceful degradation when metrics are unavailable.
Linux, macOS, Windows. systemd, OpenRC, runit, launchd — install as a service on any OS. Cross-compile for ARM64 too.
Get TheWatcher running in under a minute.
# Build from source
git clone https://github.com/patw/thewatcher.git
cd thewatcher
cargo build --release

# Run with defaults — listens on 127.0.0.1:8080
./target/release/thewatcher

# Open the dashboard
open http://127.0.0.1:8080
| Option | Default | Description |
|---|---|---|
--listen | 127.0.0.1 | Bind address |
--port | 8080 | HTTP port |
--interval | 30s | Collection interval |
--data-dir | ~/.local/share/thewatcher | Data directory |
--granular-retention | 30d | Retain granular samples |
--hourly-retention | 365d | Retain hourly summaries |
--daily-retention | 5y | Retain daily summaries |
--monthly-retention | 10y | Retain monthly summaries |
--yearly-retention | 0 (indefinite) | Retain yearly summaries |
# Safe: SSH tunnel (recommended)
ssh -L 8080:127.0.0.1:8080 admin@server
# Then open http://127.0.0.1:8080

# Direct management network
thewatcher --listen 192.168.10.25 --port 8080
All endpoints are read-only. Responses are JSON. Perfect for scripting and automation.
200 when healthy, 503 when storage is unavailable.metric, range, from/until, resolution, interface, mount params.| Parameter | Description |
|---|---|
metric | cpu, memory, disk, network, sockets |
range | 1h, 24h, 7d, 30d, 1y |
from/until | Custom epoch milliseconds (mutually exclusive with range) |
resolution | granular, hourly, daily, monthly, yearly, or auto |
interface | Network interface filter (for network metric) |
mount | Disk mount filter (for disk metric) |
# Last hour of CPU at granular resolution
curl -s "http://127.0.0.1:8080/api/history?metric=cpu&range=1h" | jq

# Last 30 days of memory
curl -s "http://127.0.0.1:8080/api/history?metric=memory&range=30d" | jq

# Network for eth0, last 7 days
curl -s "http://127.0.0.1:8080/api/history?metric=network&interface=eth0&range=7d" | jq
Platform collectors → in-memory snapshot → MooFile storage → background rollups → HTTP API + embedded web UI.
Five separate MooFile collections under the data directory:
data-dir/
├── granular.bson   ← raw 30s samples
├── hourly.bson     ← 1-hour rollups
├── daily.bson      ← 1-day rollups
├── monthly.bson    ← 30-day rollups
└── yearly.bson     ← 365-day rollups
Every document has a deterministic _id, making rollup writes idempotent and restart-safe.
| Range | Resolution | Bucket |
|---|---|---|
| ≤ 1 hour | granular | raw samples |
| ≤ 1 day | hourly | 1 hour |
| ≤ 30 days | daily | 1 day |
| ≤ 365 days | monthly | 30 days |
| > 365 days | yearly | 365 days |
src/
├── main.rs              # Entry point, collection/maintenance loops
├── lib.rs               # Module re-exports
├── cli.rs               # CLI argument parsing (clap)
├── config.rs            # Configuration struct + defaults
├── model.rs             # All data types, resolution logic
├── server.rs            # Axum HTTP server + embedded asset serving
├── api.rs               # Route handlers
├── collectors/          # CPU, memory, disk, network, sockets, uptime
├── storage/             # MooFile manager, rollup worker, retention
└── web/                 # Dashboard HTML, JS, CSS (embedded in binary)